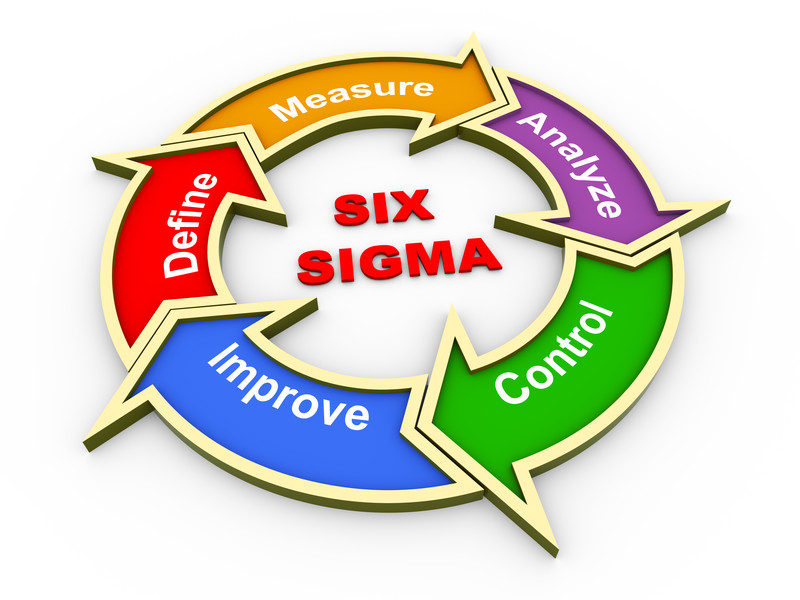
QETools Excel Add-in simplifies your data analysis by providing an easy-to-use toolbar within Excel for performing analyses and charting typically used when following the DMAIC process. The DMAIC process is a data-driven improvement cycle at the core of Six Sigma process improvement.
QETools Simplifies Process-Improvement Analysis
- Start Excel → The QETools menu appears in Excel’s ribbon (menu area).
- Analyze data that you already have in Excel → Take advantage of your skills and familiarity of Excel. There’s no need to learn a new software.
- Follow the DMAIC Roadmap to guide you in which tools to use → Not quite sure where to begin? The DMAIC Tool Roadmap guides you through each step of the DMAIC process and suggests which tools might be useful as you progress through your process-improvement project.
- Use the QETools toolbar to easily create charts and data analyses → Choose from 50+ chart types, templates and calculators/converters as you analyze your data.
Try QETools Before You Buy
There’s no risk to trying QETools today. The Demo version is fully-functioning for 28 days and can be ‘unlocked’ at any time with a full purchase. Take advantage of quantity discounts or inquire about special educational, US government or site discounts.
|
Compare QETools Functionality
QETools’ value is in its breadth of tools and ease of use.
- Over 50 chart types, templates and calculators / converters are available
- Fully integrated with Excel — Use the QETools menu to create charts, run analysis tools and call up templates
- Use the DMAIC Tool Roadmap to guide you in your analysis
Compare QETools today to your needs or against the offerings of competitors. A printable list of QETools functionality can be downloaded as a Google Document, Word Document or in PDF format. |
Screenshots
|
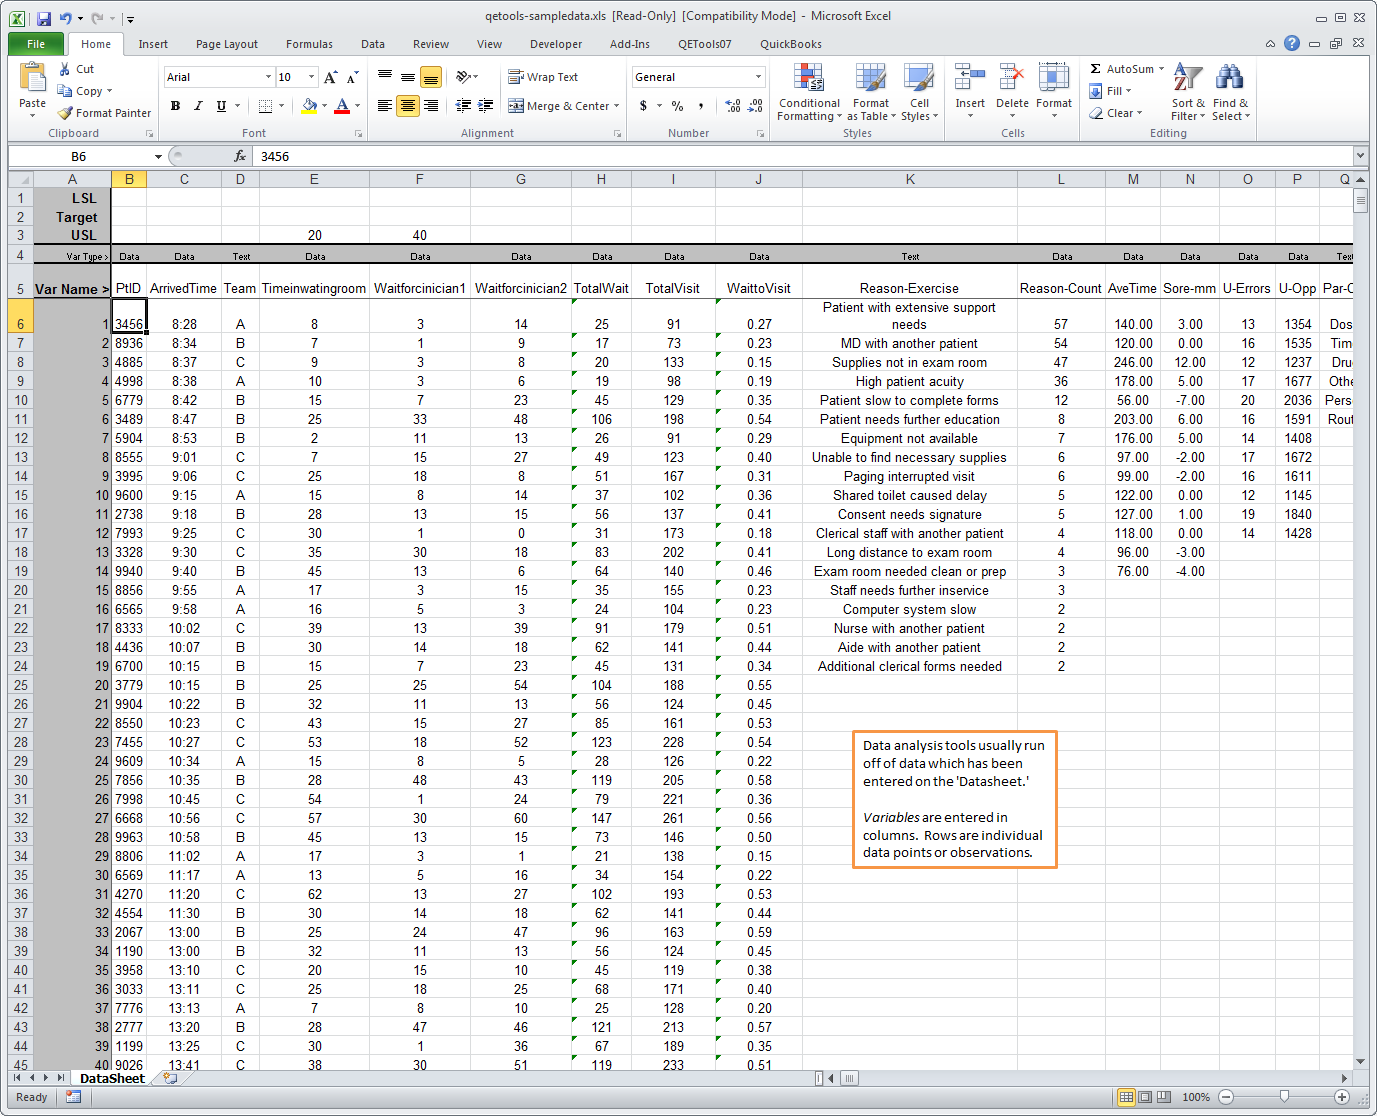
Data Worksheet |
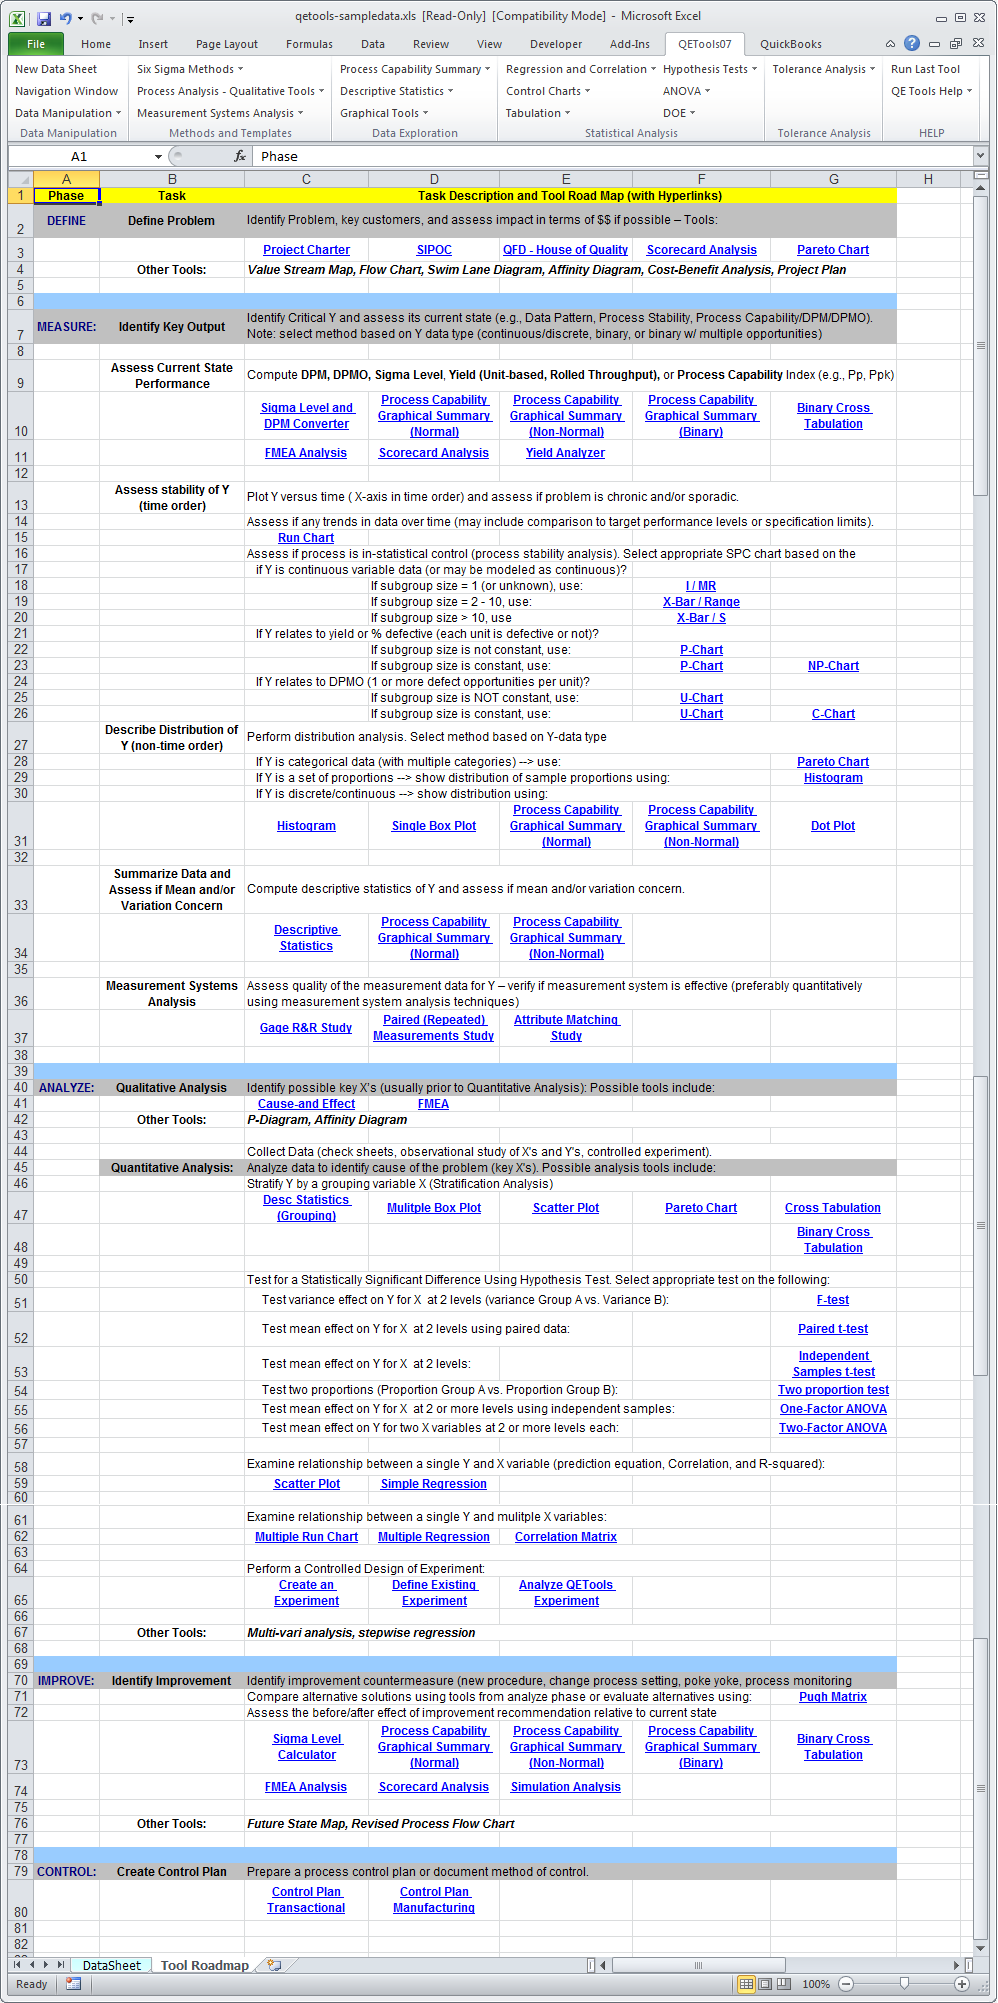
DMAIC Tool Roadmap |
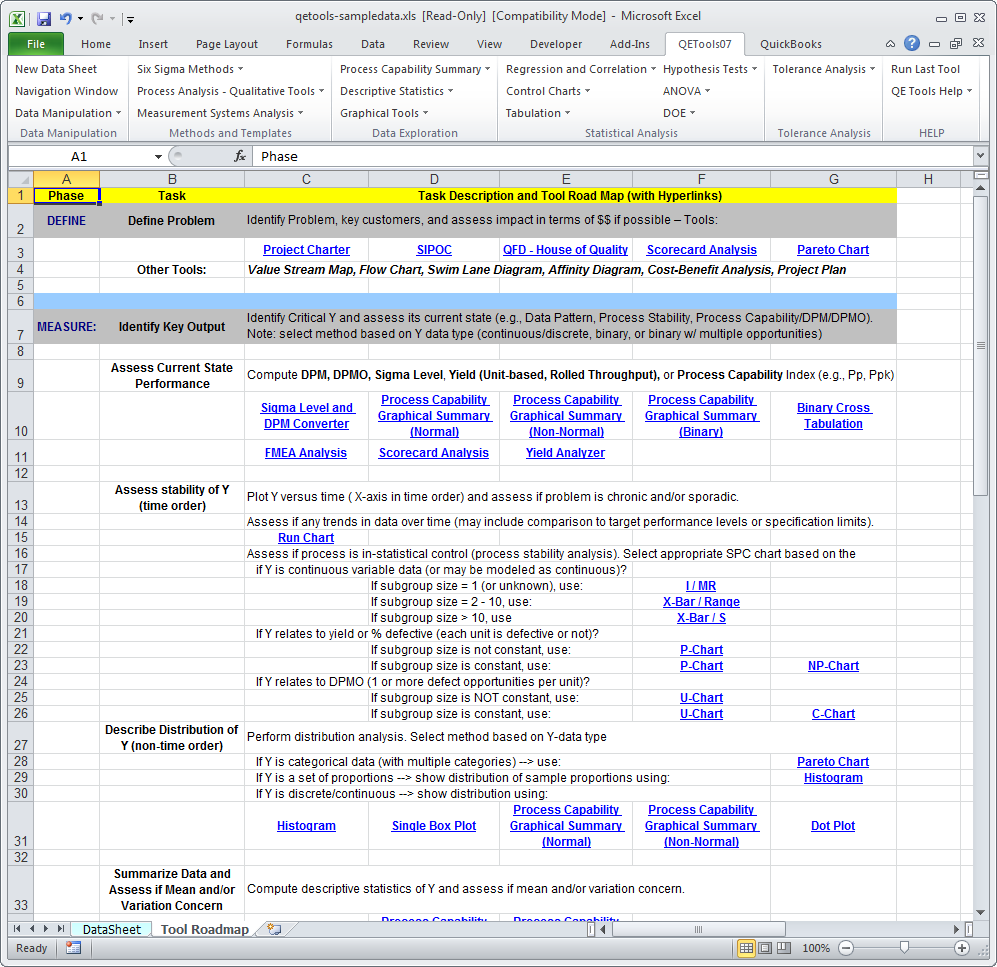
DMAIC Tool Roadmap (zoom) |
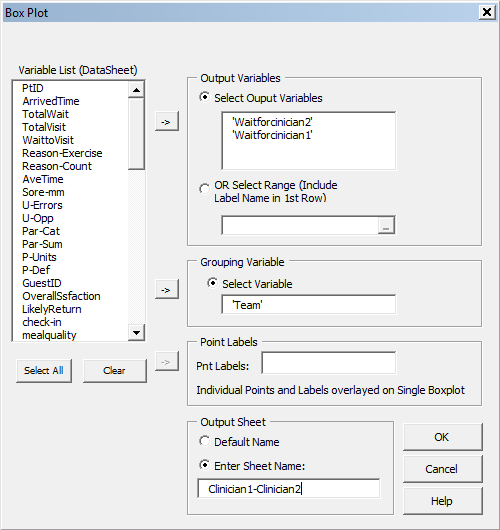
Boxplot: Variable Selection Form |
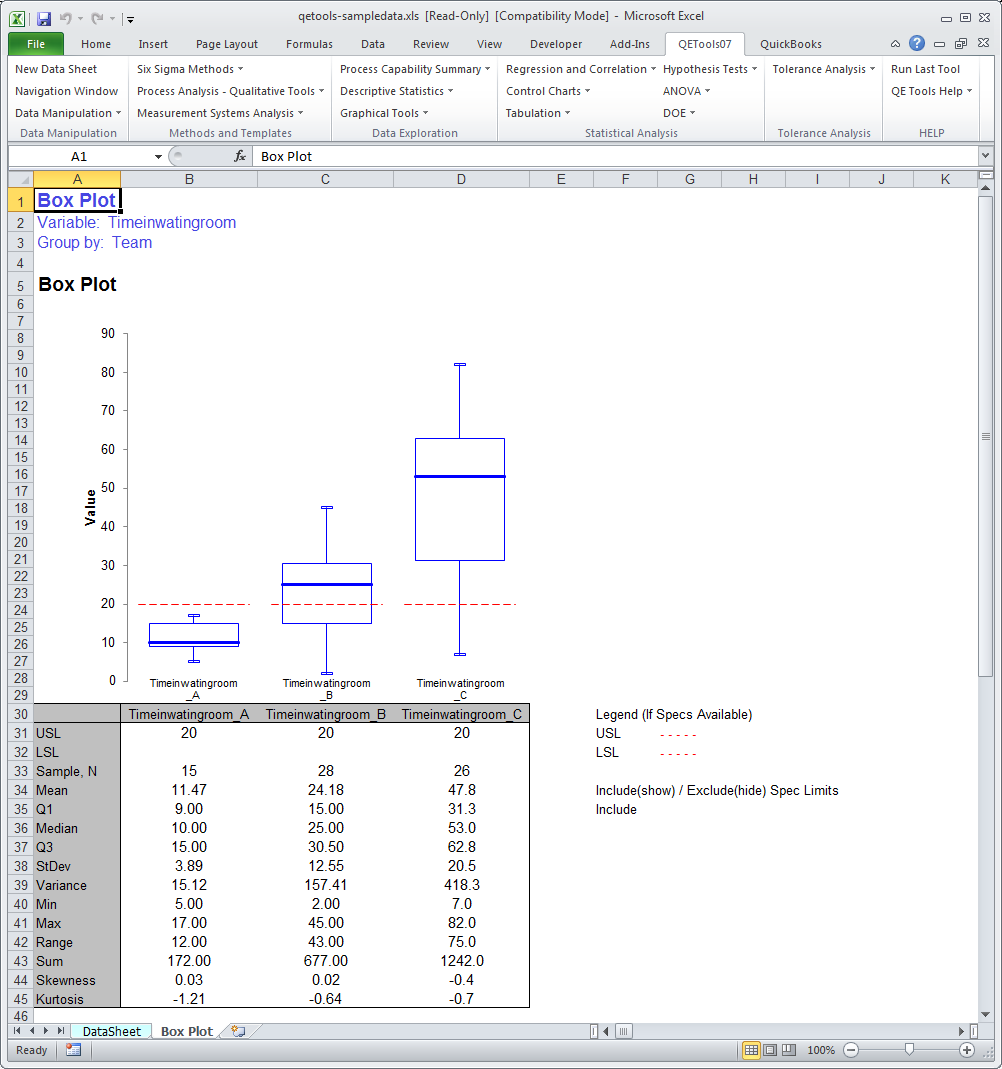
Boxplot With Grouping Variable |
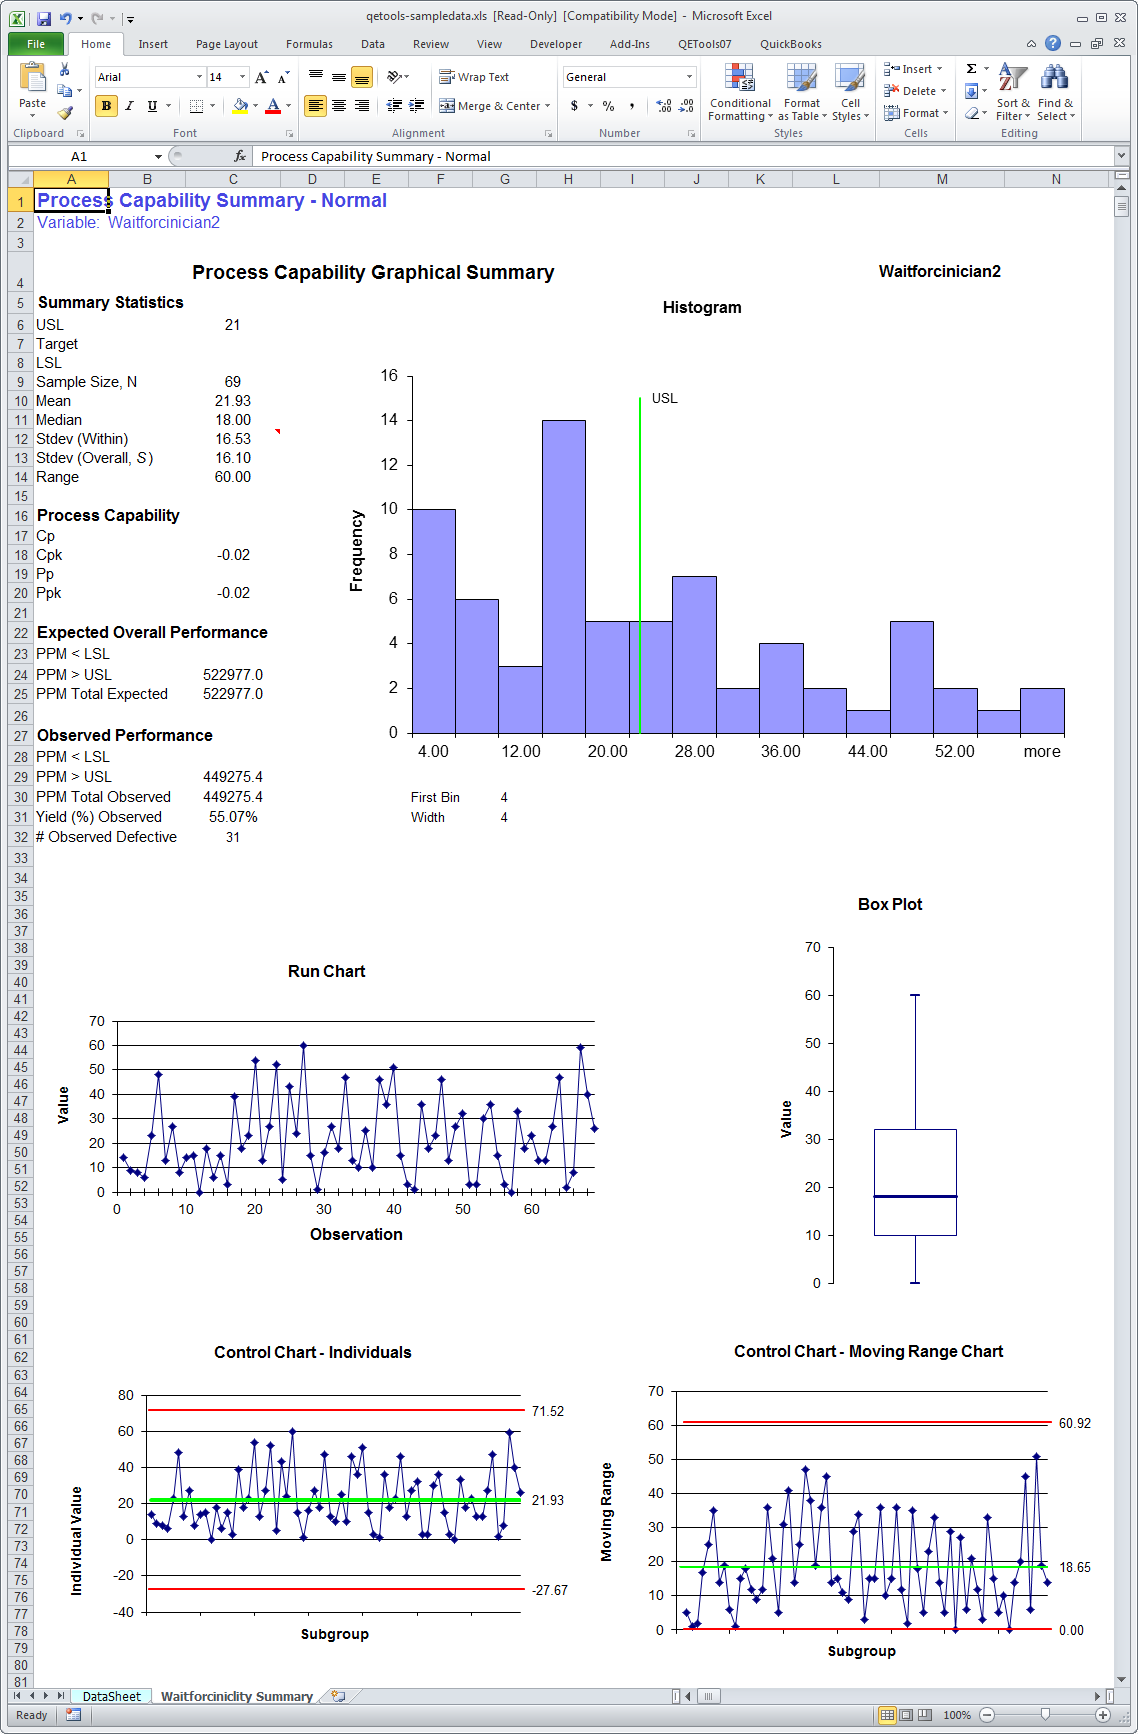
Process Capability Summary |
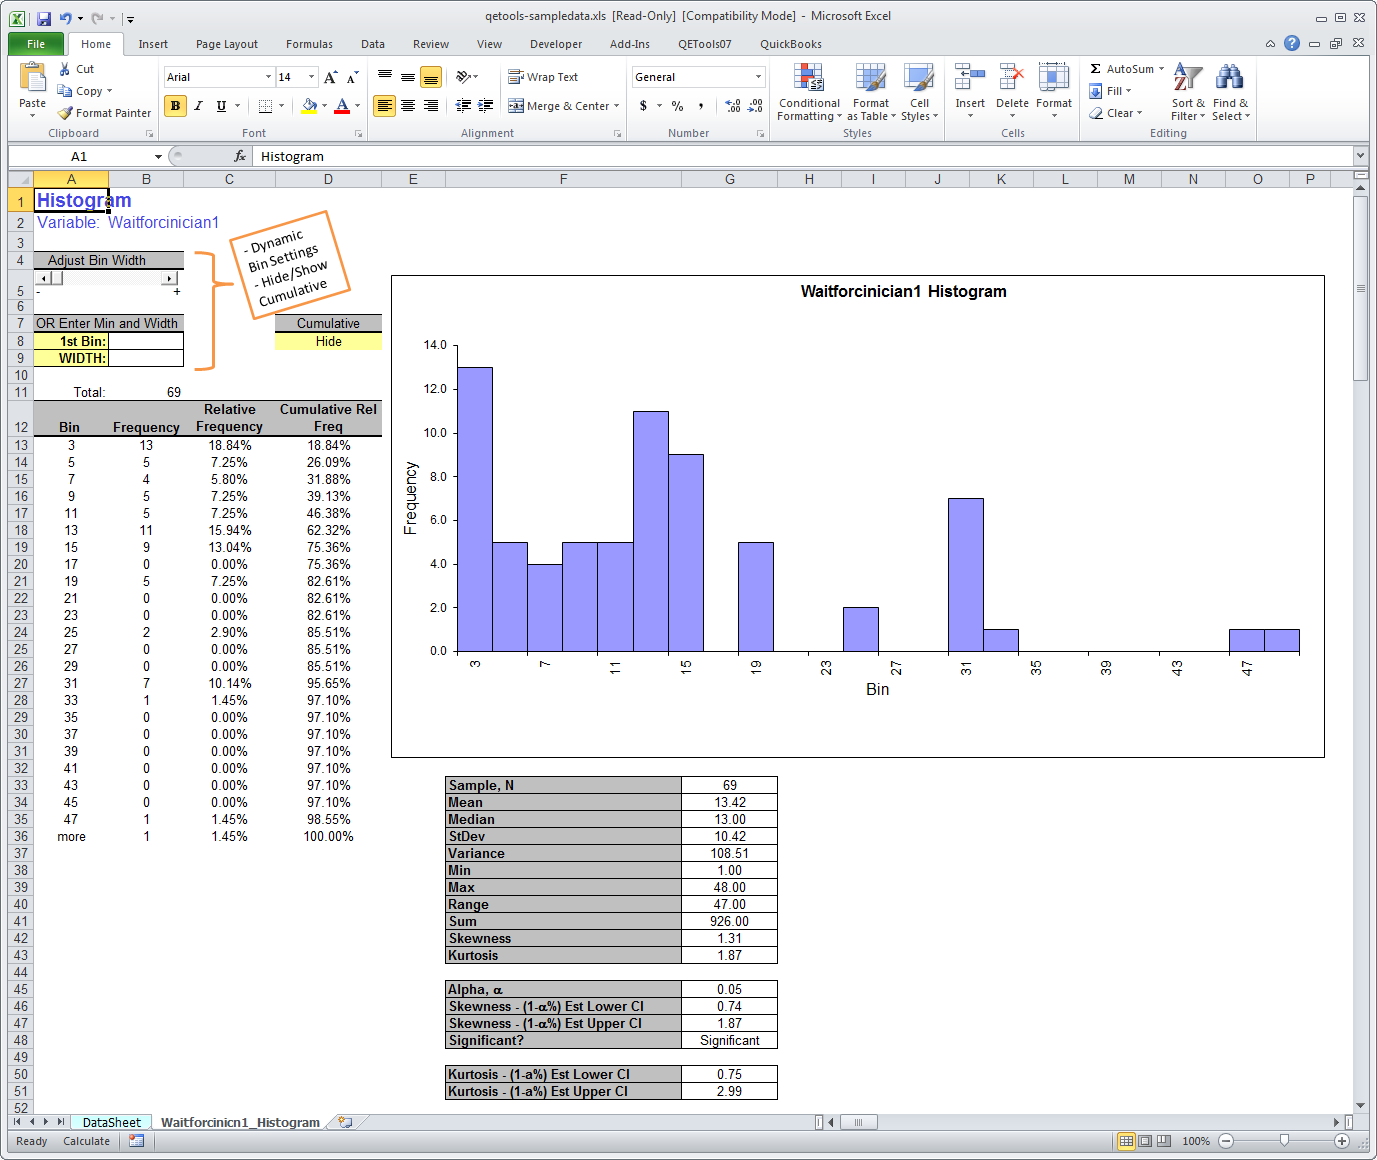
Histogram |
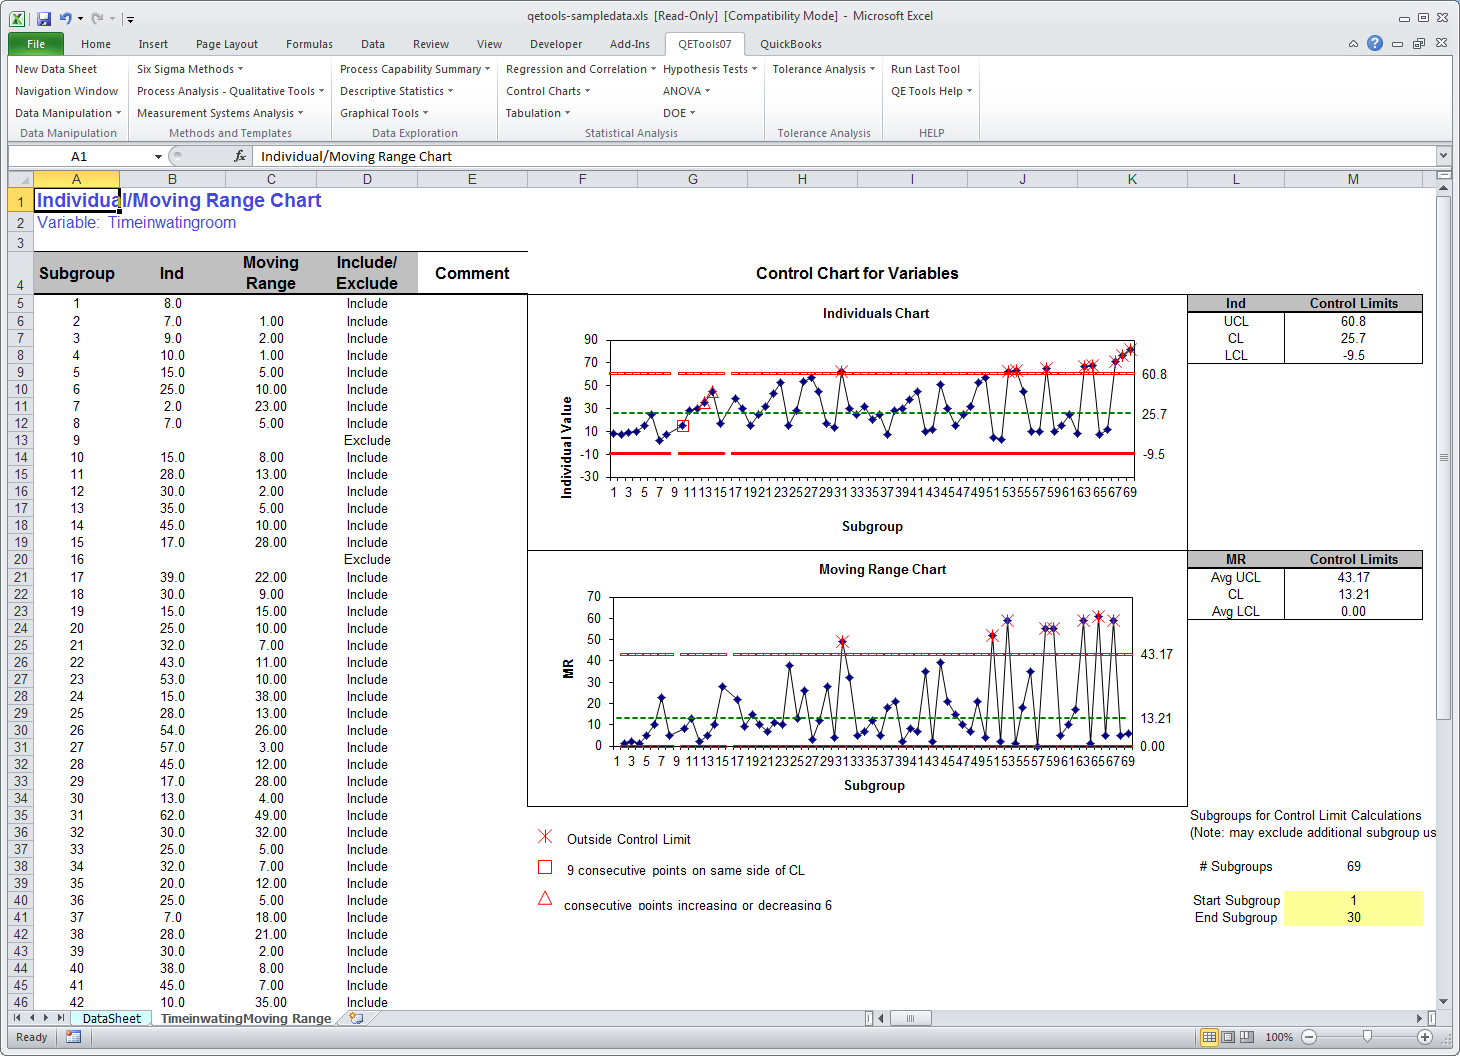
Individual / Moving Range Chart |
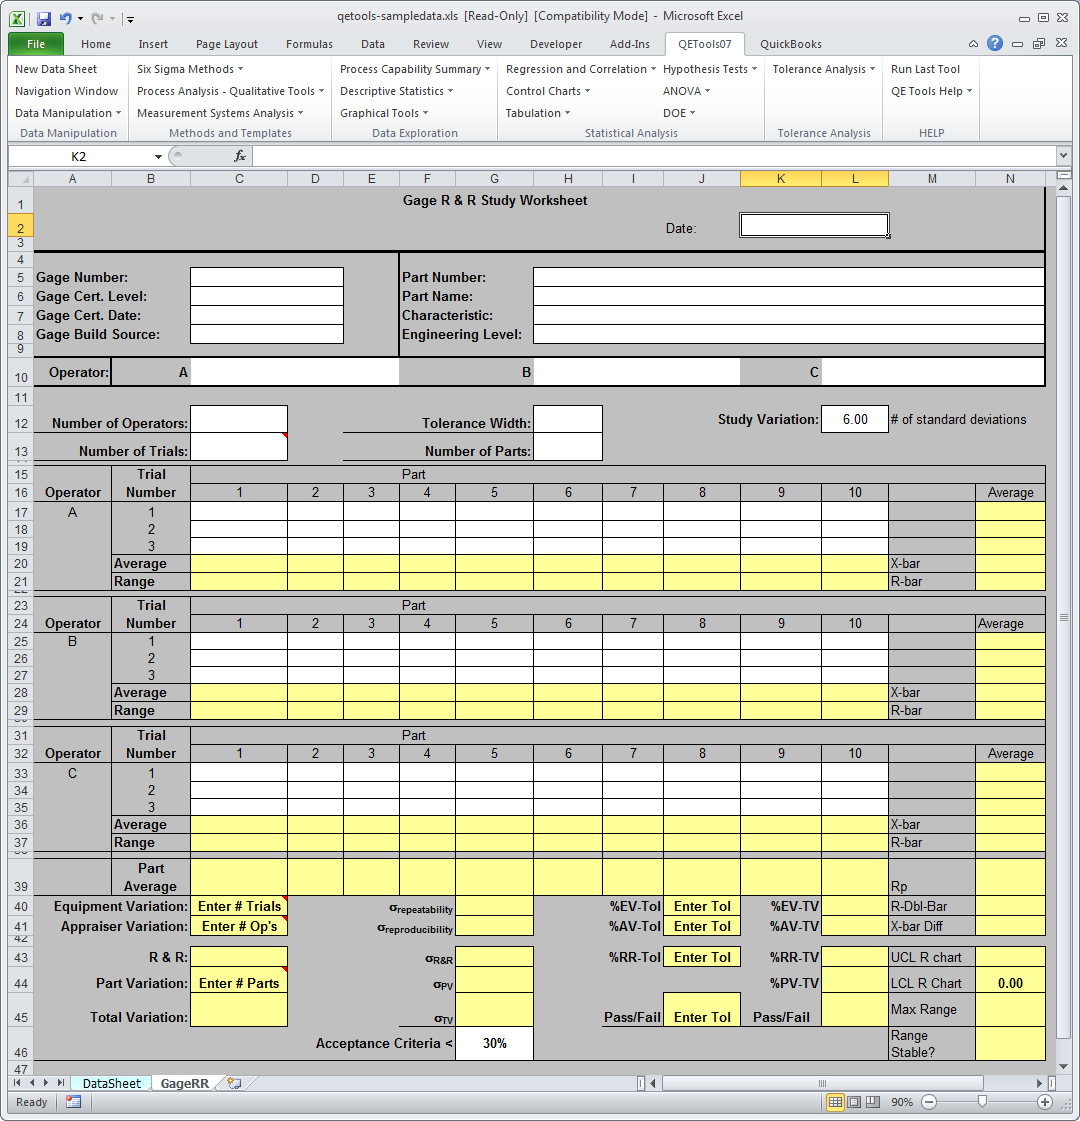
Gage R&R Template / Worksheet |
|
List of QETools Tool and Templates
[accordion]
[spoiler title=”Data Manipulation”]
| Subset Data |
| Data-Driven Tool |
| |
Screenshot |
| |
Help |
|
| Split Data by Group |
| Data-Driven Tool |
| |
Screenshot |
| |
Help |
|
[/spoiler]
[spoiler title=”Six Sigma Methods”]
| DMAIC Tool Roadmap |
| Template |
| |
Screenshot |
| |
Help |
|
| Project Charter Template |
| Template |
| |
Screenshot |
| |
Help |
|
[/spoiler]
[spoiler title=”Process Analysis – Qualitative Tools”]
| SIPOC |
| Data-Driven Tool |
| |
Screenshot |
| |
Help |
|
| Cause & Effect Diagram |
| Data-Driven Tool |
| |
Screenshot |
| |
Help |
|
| FMEA Table |
| Template |
| |
Screenshot |
| |
Help |
|
| Process Control Plan – Manufacturing |
| Template |
| |
Screenshot |
| |
Help |
|
| Process Control Plan – Transactional |
| Template |
| |
Screenshot |
| |
Help |
|
| QFD – House of Quality |
| Dynamic Template* |
| |
Screenshot |
| |
Help |
|
| Pugh Matrix |
| Dynamic Template* |
| |
Screenshot |
| |
Help |
|
| Scorecard |
| Dynamic Template* |
| |
Screenshot |
| |
Help |
|
| TRIZ |
| Dynamic Template* |
| |
Screenshot |
| |
Help |
|
| Cause & Effect Matrix |
| Dynamic Template* |
| |
Screenshot |
| |
Help |
|
[/spoiler]
[spoiler title=”Measurement Systems Analysis”]
| Gage R & R |
| Template |
| |
Screenshot |
| |
Help |
|
| Paired (Repeated) Measurements Study |
| Data-Driven Tool / Template |
| |
Screenshot |
| |
Help |
|
| Attribute Matching Study |
| Template |
| |
Screenshot |
| |
Help |
|
[/spoiler]
[spoiler title=”Process Capability Summary”]
| Sigma Level and DPM Converter |
| Template / Calculator |
| |
Screenshot |
| |
Help |
|
| Tolerance and Process Capability Converter |
| Template / Calculator |
| |
Screenshot |
| |
Help |
|
| Process Capability Summary – Normal |
| Data-Driven Tool |
| |
Screenshot |
| |
Help |
|
| Process Capability Summary – Non-Normal (Weibull) |
| Data-Driven Tool |
| |
Screenshot |
| |
Help |
|
| Process Capability Summary – Binary (Binomial) |
| Data-Driven Tool |
| |
Screenshot |
| |
Help |
|
| Yield Analyzer |
| Dynamic Template* |
| |
Screenshot |
| |
Help |
|
[/spoiler]
[spoiler title=”Descriptive Statistics”]
| Basic Descriptive Statistics |
| Data-Driven Tool |
| |
Screenshot |
| |
Help |
|
| Frequency Analysis |
| Data-Driven Tool |
| |
Screenshot |
| |
Help |
|
| Ordinal Data Summary |
| Dynamic Template* |
| |
Screenshot |
| |
Help |
|
[/spoiler]
[spoiler title=”Graphical Tools”]
| Run Chart |
| Data-Driven Tool |
| |
Screenshot |
| |
Help |
|
| Pareto Analysis |
| Data-Driven Tool |
| |
Screenshot |
| |
Help |
|
| Histogram |
| Data-Driven Tool |
| |
Screenshot |
| |
Help |
|
| Dot Plot |
| Data-Driven Tool |
| |
Screenshot |
| |
Help |
|
| Frequency Bar Graph |
| Data-Driven Tool |
| |
Screenshot |
| |
Help |
|
| Box Plot (single- or multi-) |
| Data-Driven Tool |
| |
Screenshot |
| |
Help |
|
| Scatter Plot |
| Data-Driven Tool |
| |
Screenshot |
| |
Help |
|
| Distribution ID |
| Data-Driven Tool |
| |
Screenshot |
| |
Help |
|
| Individual Values Plot |
| Data-Driven Tool |
| |
Screenshot |
| |
Help |
|
[/spoiler]
[spoiler title=”Regression & Correlation”]
| Correlation Matrix |
| Data-Driven Tool |
| |
Screenshot |
| |
Help |
|
| Linear Regression |
| Data-Driven Tool |
| |
Screenshot |
| |
Help |
|
[/spoiler]
[spoiler title=”Control Charts / Statistical Process Control (SPC)”]
| X-Bar / Range |
| Data-Driven Tool |
| |
Screenshot |
| |
Help |
|
| X-Bar / S |
| Data-Driven Tool |
| |
Screenshot |
| |
Help |
|
| Individual / Moving Range |
| Data-Driven Tool |
| |
Screenshot |
| |
Help |
|
| P Chart |
| Data-Driven Tool |
| |
Screenshot |
| |
Help |
|
| NP Chart |
| Data-Driven Tool |
| |
Screenshot |
| |
Help |
|
| U Chart |
| Data-Driven Tool |
| |
Screenshot |
| |
Help |
|
| C Chart |
| Data-Driven Tool |
| |
Screenshot |
| |
Help |
|
| G Chart |
| Data-Driven Tool |
| |
Screenshot |
| |
Help |
|
[/spoiler]
[spoiler title=”Tabulation”]
| One-Way Tabulation (text or data) |
| Data-Driven Tool |
| |
Screenshot |
| |
Help |
|
| Cross Tabulation |
| Data-Driven Tool |
| |
Screenshot |
| |
Help |
|
| Binary Cross Tabulation |
| Data-Driven Tool |
| |
Screenshot |
| |
Help |
|
[/spoiler]
[spoiler title=”Hypothesis Tests”]
| Test Variance – Standard (1 variable) |
| Data-Driven Tool / Template |
| |
Screenshot |
| |
Help |
|
| Test Mean – Standard (1 variable) |
| Data-Driven Tool / Template |
| |
Screenshot |
| |
Help |
|
| Test Two Variances |
| Data-Driven Tool / Template |
| |
Screenshot |
| |
Help |
|
| Test Two Means – Independent |
| Data-Driven Tool / Template |
| |
Screenshot |
| |
Help |
|
| Test Paired Data |
| Data-Driven Tool / Template |
| |
Screenshot |
| |
Help |
|
| Test One Proportion |
| Template / Calculator |
| |
Screenshot |
| |
Help |
|
| Test Two Proportion |
| Data-Driven Tool |
| |
Screenshot |
| |
Help |
|
[/spoiler]
[spoiler title=”ANOVA”]
| One-Way ANOVA |
| Data-Driven Tool |
| |
Screenshot |
| |
Help |
|
| One-Way ANOVA Table |
| Data-Driven Tool |
| |
Screenshot |
| |
Help |
|
| Two-Way ANOVA |
| Data-Driven Tool |
| |
Screenshot |
| |
Help |
|
[/spoiler]
[spoiler title=”Design of Experiments (DOE)”]
| Design of Experiments (DOE) |
| Data-Driven Tool |
| |
Screenshot |
| |
Help |
|
[/spoiler]
[/accordion]
* Dynamic Templates have buttons on the Excel Worksheet which do not function on Mac. Several Data-Driven Tools (those which manipulate data which has been entered on the Datasheet) also have output features which rely on on-worksheet buttons that do not function on Mac.
System Requirements
QETools v11 is supported on Windows-based computers through Windows 7 and Excel 2011 (32- and 64-bit systems). While it is expected that QETools will work on upcoming releases of Windows and Office, there may be minor issues which need addressing. Please provide feedback regarding any specific issues and we will work to fix them. * There has been some feedback that QETools runs on Mac with Parallels (Windows emulation software). However, the functionality of Mac-based Excel lags Windows versions meaning that some tools may not work.

 QETools Excel Add-in simplifies your data analysis by providing an easy-to-use toolbar within Excel for performing analyses and charting typically used when following the DMAIC process. The DMAIC process is a data-driven improvement cycle at the core of Six Sigma process improvement.